ENJOY WALK ACROSS
THE ELIZABETH STREET
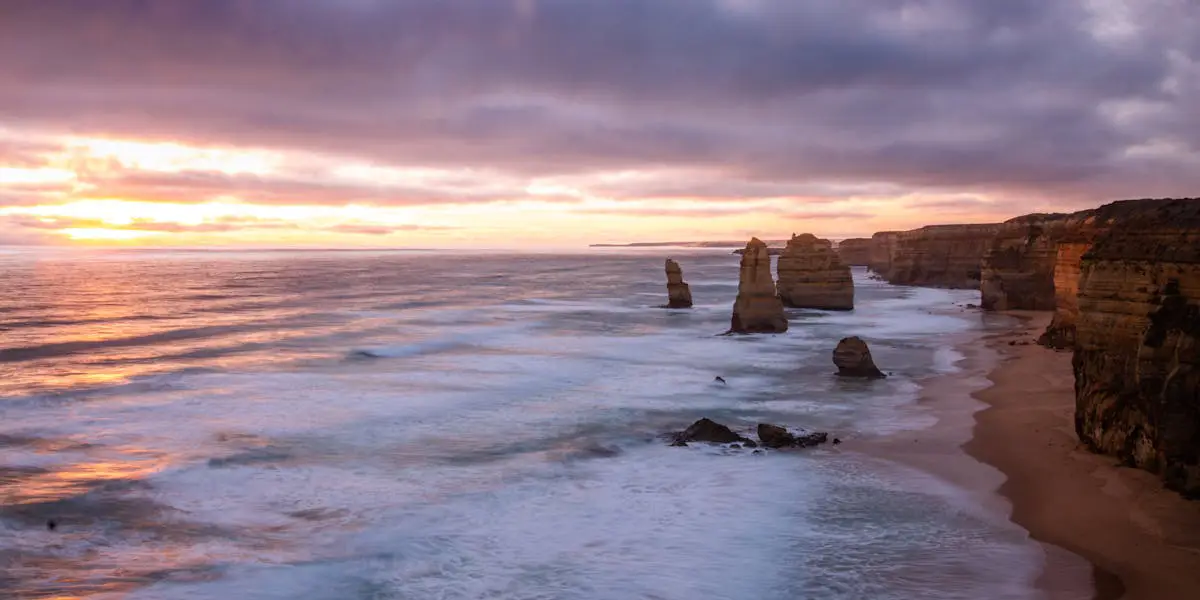
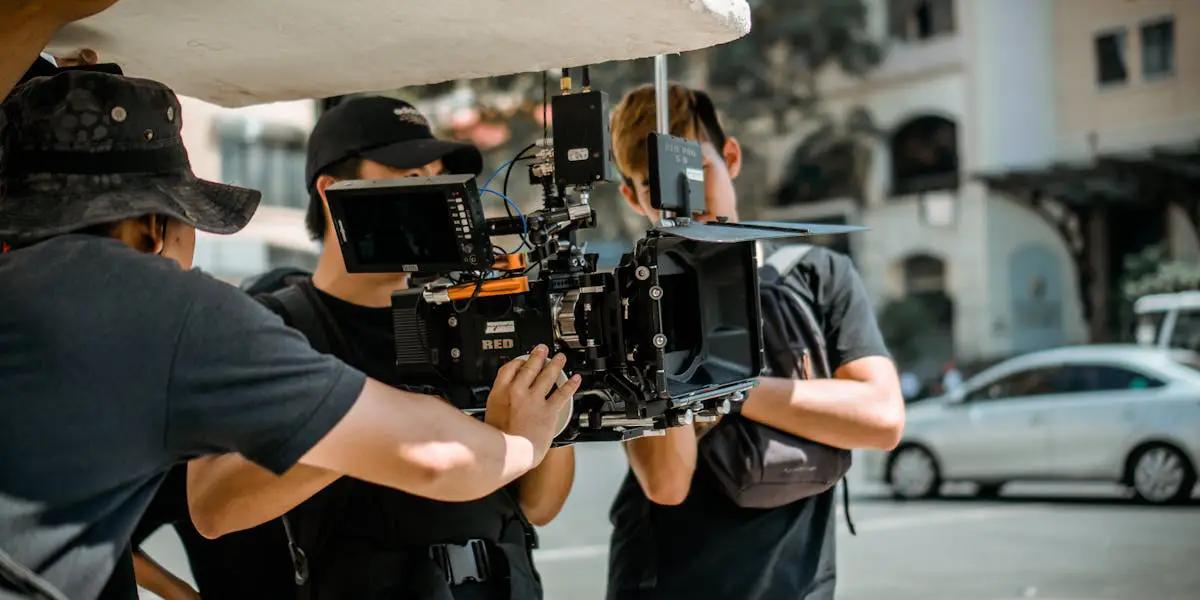
From beautiful dense greenery to the spectacular coastlines and everything in between, Victoria is the home of some stunning and accessible location where you can shoot your movie. The architectural cityscapes and the natural landscapes of the place have attracted numerous national and international filmmakers over the years. Whether it is Aussie classics, novel adaptations, historical drama or action films, north-east Victoria has everything in it. The towns, laneways and world-class soundstages make the region an ideal platform to make an epic tale. We have a team of professionals who are analyses different new places on specific parameters before adding the locations to our collection.
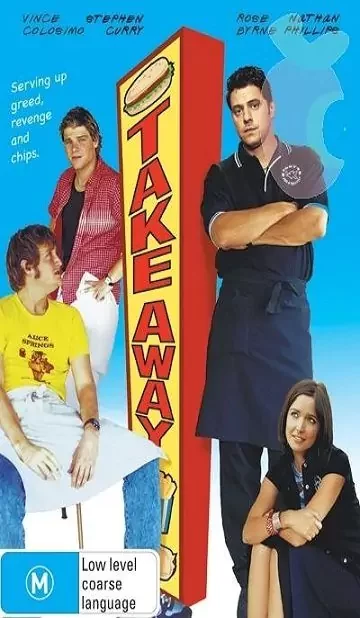
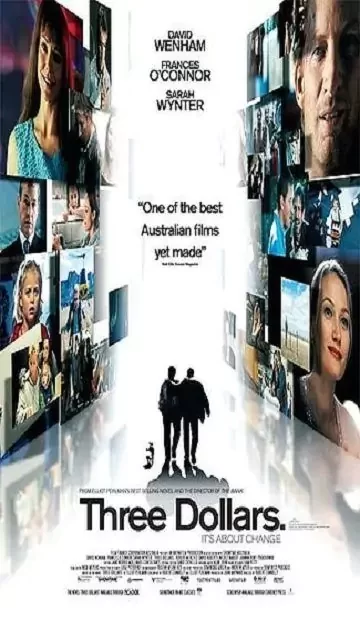
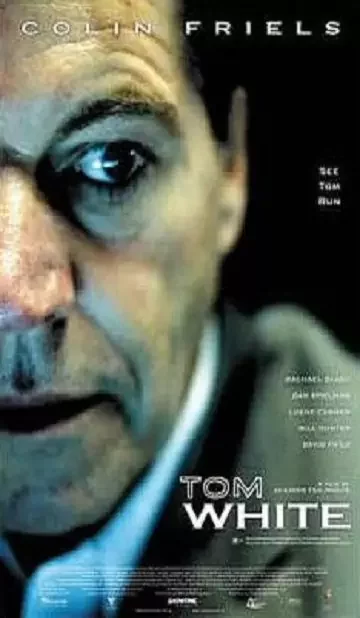
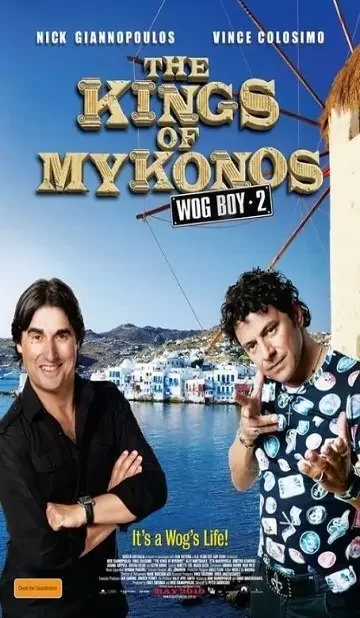
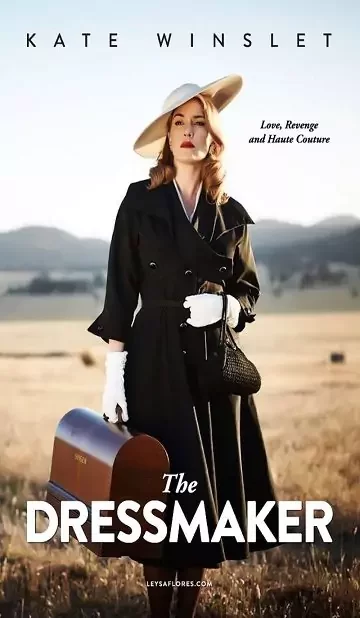
If you are looking for a location, you can contact us. Not many are aware of the fact, but some of the massive projects have been filmed in this side of the Country such as The Dressmaker (2015), Knowing and Where The Wilds Things Are (2009), Ghost Rider (2007), Charlotte’s Web (2006), Queen of the Damned (2002), Mad Max (1979) and so on. Depending on the requirements and scope of your project, we might help you to discuss the relevant authorities, community groups, businesses, individuals and residents who could be affected by activities of the film.
From mesmerising coastlines to dramatic desert location, we can help you find the ideal location in Victoria for your next project. Our experts have years of experience in finding accessible locations for shooting. If you have a specific place in your mind, then give us a call. We are always happy to assist you. Our company focuses on adding new locations in Victoria to the existing collection so that we can meet the requirements of our clients. If you have an old horse stable, house, mansion, snow resort or warehouse, then we will try to promote it as a film-friendly location.Whatever your requirements might be, we will try to find the perfect movie location in Victoria that will match your needs. Our team of professionals will scout all the destinations across this region and find the most iconic and film-worthy spots and we will assist you in getting the permissions and organising the shoots for your films there. You can call us and consult with our expert team and together we will collaborate to find the perfect location to kickstart your film career. So, call us today and book the best film locations in Victoria and enjoy a pleasant film-making experience.


MOVIE MAGIC
MELBOURNE TRIVIA
- Three Reasons for Filmmaking in Melbourne, Victoria
- Strategic Partnership between filmmakers and the statutory authority of the State Government.
- The digital promotion policy gave huge exposure to the film fraternity of Australia.
- Enjoy scenic beauty and grab Melbourne Business for sale opportunities in filmmaking industry
Latest Blog
Why Filming In Victoria Is Highly Beneficial